Research · July 2026 · data file ML-1000
The 2026 U.S. Dropshipping & Amazon FBA Supplier Report
What 2,238 verified U.S. suppliers look like when you check every domain, every email, and every contact field instead of scraping a stale directory. Industry mix, state concentration, verification results, and what the numbers mean for sourcing in 2026.
1. Market at a glance
This report covers 2,238 companies operating dropshipping and Amazon FBA supplier activity in the U.S. The data went through a full pipeline: collection, parsing, deduplication, domain verification, email verification, and scoring. Every figure below was counted from the current file (ML-1000), verified July 2026.
The headline number that matters: 1,090 of 2,238 companies (49%) are fully outreach-ready — valid email, active domain, and complete contact information. That is the number most supplier lists cannot give you, because most supplier lists never verify anything.
2. Where the suppliers actually are — by industry
After standardization, the market splits into 33 industry categories. The top 15 cover the overwhelming majority of records:
| Industry | Companies | Share |
|---|---|---|
| Retail & E-commerce | 393 | 17.6% |
| Wholesale & Distribution | 347 | 15.5% |
| Food & Beverage | 325 | 14.5% |
| Beauty & Cosmetics | 181 | 8.1% |
| Sports & Outdoor | 174 | 7.8% |
| Electronics & Technology | 150 | 6.7% |
| Apparel & Fashion | 145 | 6.5% |
| Pet Products | 120 | 5.4% |
| Industrial & Manufacturing | 84 | 3.8% |
| Toys & Games | 50 | 2.2% |
| Health & Medical | 46 | 2.1% |
| Automotive | 43 | 1.9% |
| Home & Furniture | 23 | 1.0% |
| Business Services | 21 | 0.9% |
| Logistics & Transportation | 13 | 0.6% |
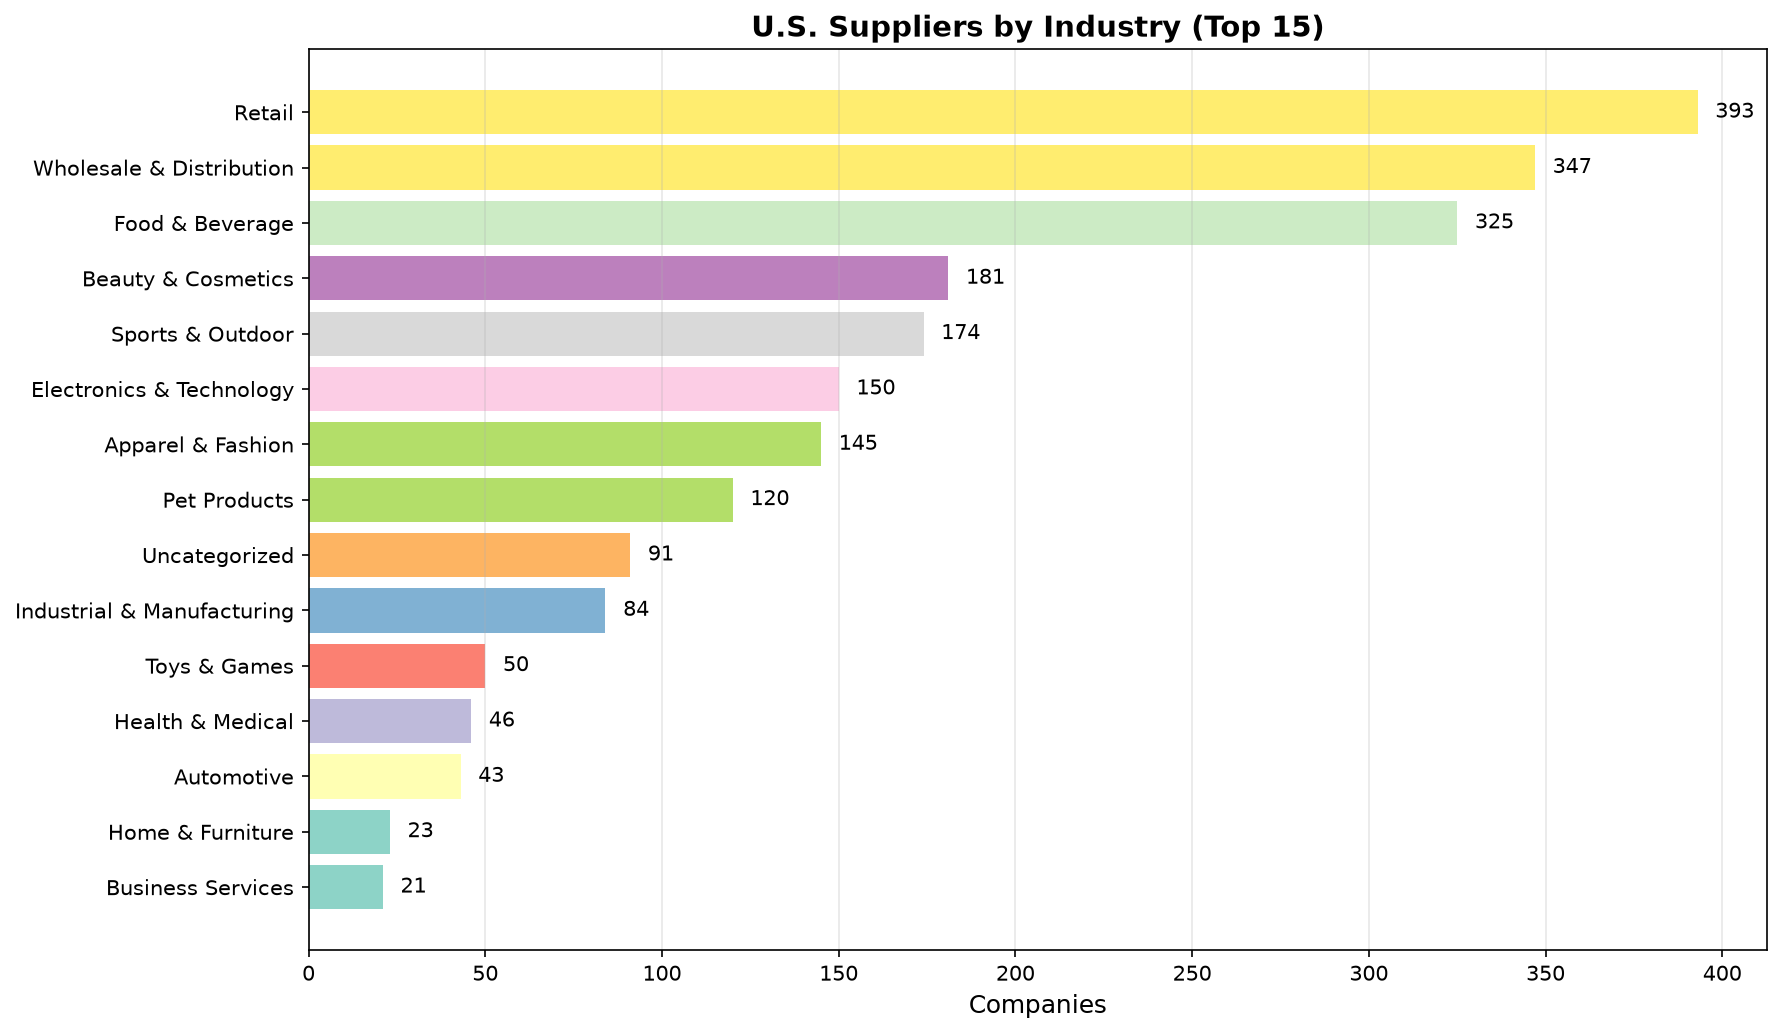
Retail (393) and Wholesale & Distribution (347) together account for roughly a third of the file — the U.S. supplier market is built on third-party logistics and distributor networks. Food & Beverage ranks third at 325; specialty food (organic, gluten-free, small-batch) is where the dropship/FBA model actually works in that category. Beauty & Cosmetics (181) is the highest-margin-per-weight niche in the file.
3. Where the suppliers actually are — by state
| State | Companies | Share | Dominant industry |
|---|---|---|---|
| California | 153 | 9.5% | Retail |
| Florida | 77 | 4.8% | Wholesale |
| Texas | 74 | 4.6% | Industrial |
| New York | 68 | 4.2% | Apparel |
| Oregon | 56 | 3.5% | Retail |
| Colorado | 50 | 3.1% | Outdoor |
| Washington | 42 | 2.6% | Technology |
| Ohio | 40 | 2.5% | Industrial |
| Georgia | 40 | 2.5% | Food |
| New Jersey | 35 | 2.2% | Wholesale |
The market is concentrated in ten states. California leads on technology and beauty; Florida is general merchandise and low-tax logistics; Texas dominates industrial and wholesale; New York is apparel. If you are choosing a supplier pool for shipping economics, this concentration matters more than the total count.
4. Company size — who you are actually mailing
| Class | Count | Share | Definition |
|---|---|---|---|
| Enterprise | 268 | 12% | 100+ employees or $50M+ revenue |
| Mid-Market | 595 | 27% | 50–100 employees or $10–50M revenue |
| SMB | 165 | 7% | 10–50 employees or $1–10M revenue |
| Unknown | 1,210 | 54% | Size not reported (mostly small operators) |
Over half the file does not report size — consistent with small dropshippers. But 268 enterprise-class suppliers are in there: large distributors, product-specific FBA suppliers, and institutional wholesalers. The 595 mid-market companies are the practical sweet spot for outreach: big enough to matter, small enough to answer.
5. Outreach readiness scores 0–100
Every company is scored 0–100 for outreach readiness, built from four signals:
- Email valid (MX) — +40 points
- Phone on file — +20 points
- Domain active — +20 points
- Social presence (Facebook / LinkedIn / Twitter) — +20 points
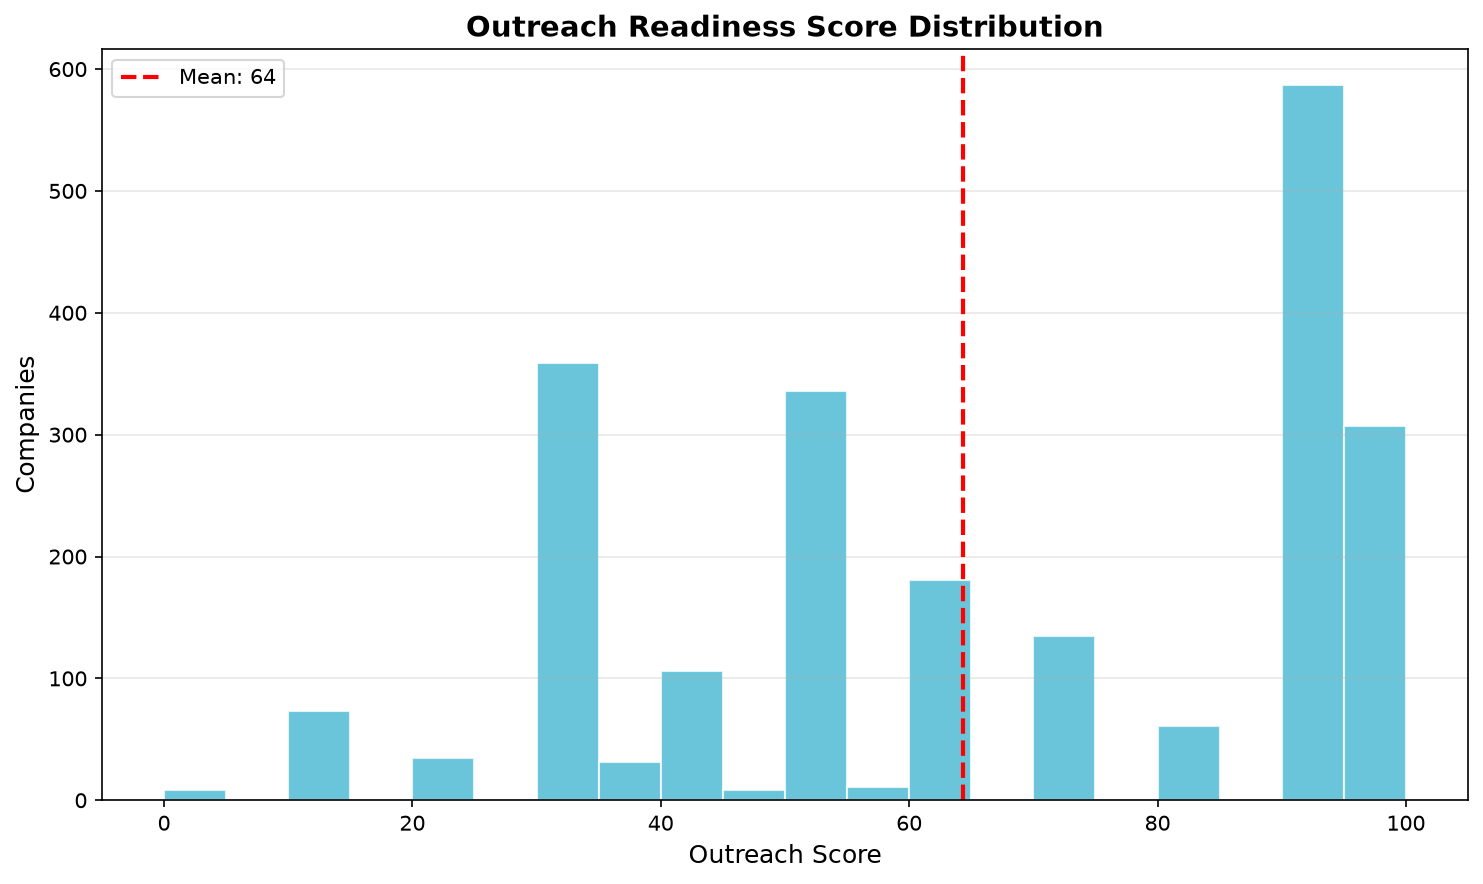
| Tier | Score | Companies | Share |
|---|---|---|---|
| High | 70+ | 1,090 | 49% |
| Medium | 40–70 | 642 | 29% |
| Low | <40 | 506 | 23% |
6. Verification results — the part competitors skip
| Check | Count | Share |
|---|---|---|
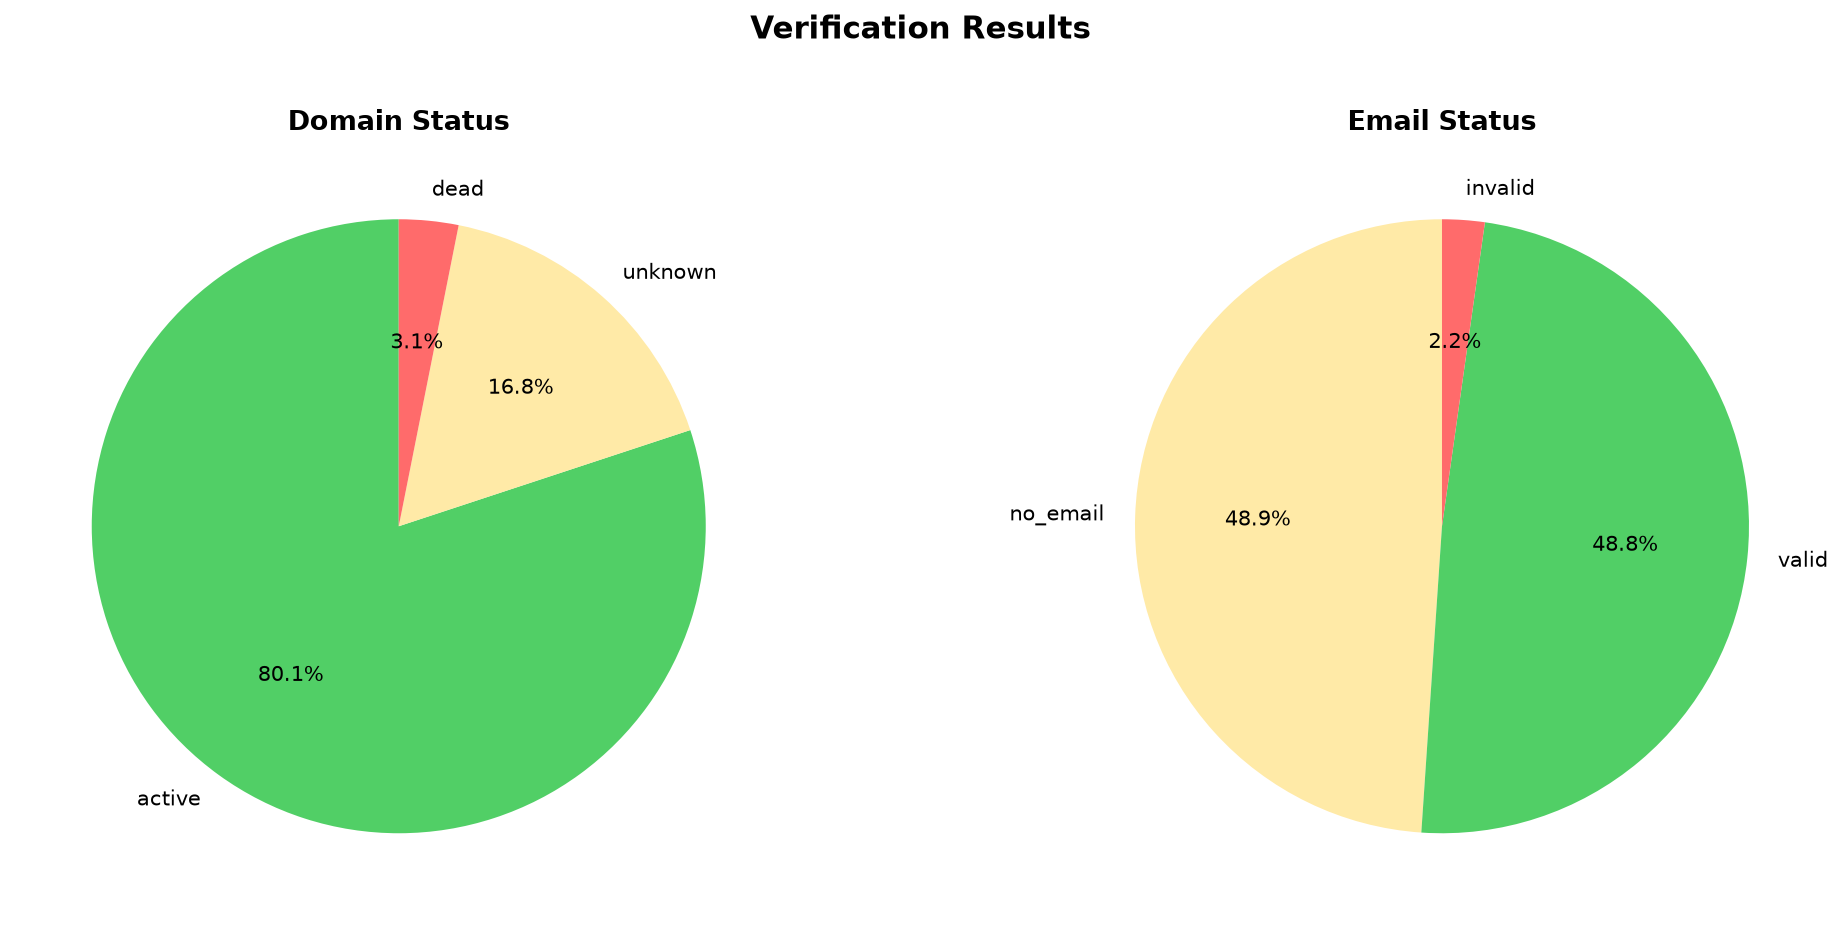
| Domain — active | 1,792 | 80.1% |
| Domain — dead | 70 | 3.1% |
| Domain — unknown | 375 | 16.8% |
| Email — valid MX | 1,093 | 48.8% |
| Email — invalid MX | 50 | 2.2% |
| Email — absent | 1,095 | 49.0% |
7. Methodology — how the file was built
Collection: public company records, registries, and directory listings for 2,403 U.S. businesses operating dropshipping / FBA activity.
Cleaning: parse errors fixed, bogus year values cleared, values leaked from other columns corrected, then domain-based deduplication removed 165 duplicates — 2,403 → 2,238.
Verification: domains checked via MX record (dnspython) + HTTP HEAD (requests); emails checked via MX on the host through Google DNS. 80 parallel workers finished in ~6 minutes.
Standardization: 73 raw industry labels mapped to 33 standard categories; the "uncategorized" bucket fell from 1,120 to 91.
Enrichment: social-presence score, outreach-readiness score, and Enterprise / Mid-Market / SMB sizing added to every record.
8. What this means for sourcing
- Start with the 1,090 outreach-ready companies (score 70+), not the whole file — they are the ones with a valid email and a live domain today.
- Use the 268 enterprise and 595 mid-market rows for B2B-style outreach; the small, size-unknown majority is where margins vary most.
- California, Florida, Texas, New York give you 372 of the top-10-state leads — worth prioritizing when shipping economics matter.
- Beauty, Food and Pet are the value-per-record niches in the file: high margin per unit, high fit with the dropship/FBA model.
That is the whole dataset, sliced. If you want it as a file — domain and email status per record, phone and LinkedIn data, outreach scores, sized tiers, plus industry-specific shortlists and email templates — it is available one-time below.